Atarim for QA Engineers: Tracking and Managing Feedback
File bugs that carry their own repro context — element, URL, browser, viewport, and a screenshot — then verify the fix in the same thread.
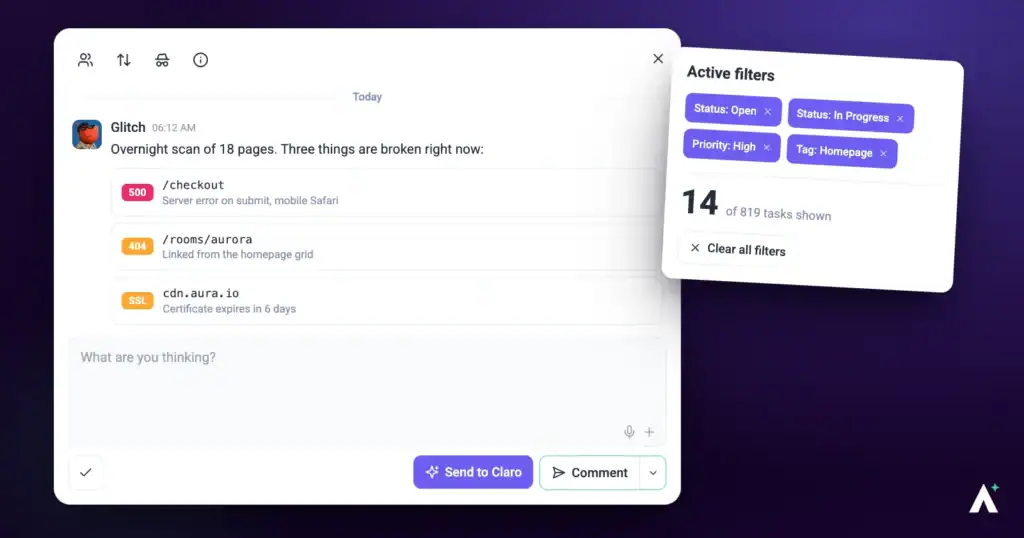
Most of a QA engineer’s wasted time goes on the same two things: writing down context a tool could have captured, and re-testing something that was closed without anyone telling you. Atarim removes the first by recording repro conditions when the task is created, and the second by giving you a status that means “ready for you to verify”.
Everything a developer would otherwise ask for, captured at the moment the bug was found.
Most of a QA engineer’s wasted time goes on the same two things: writing down context a tool could have captured, and re-testing something that was closed without anyone telling you.
Atarim removes the first by recording repro conditions when the task is created, and the second by giving you a status that means “ready for you to verify”. This guide is about testing and verification specifically, rather than general task use.
Filing a Defect
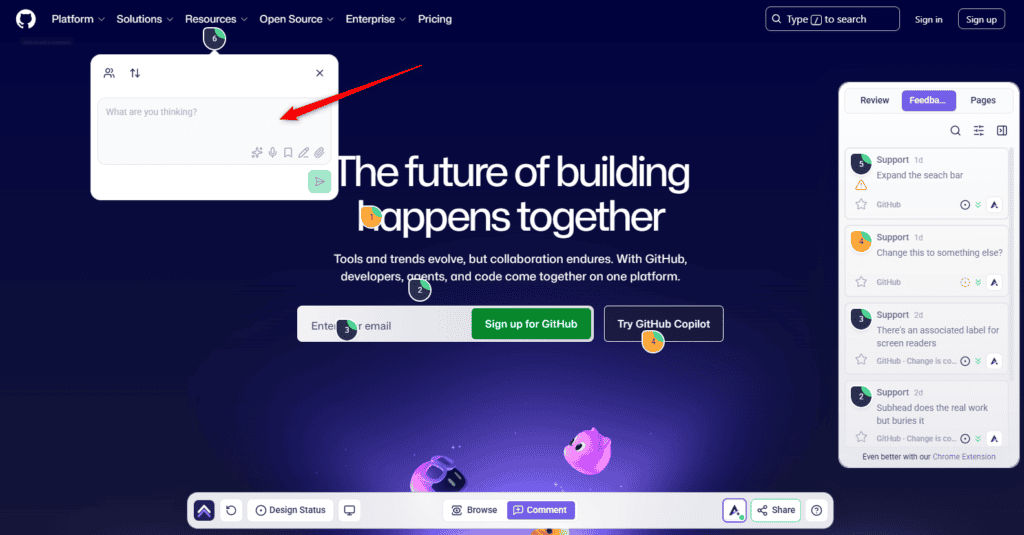
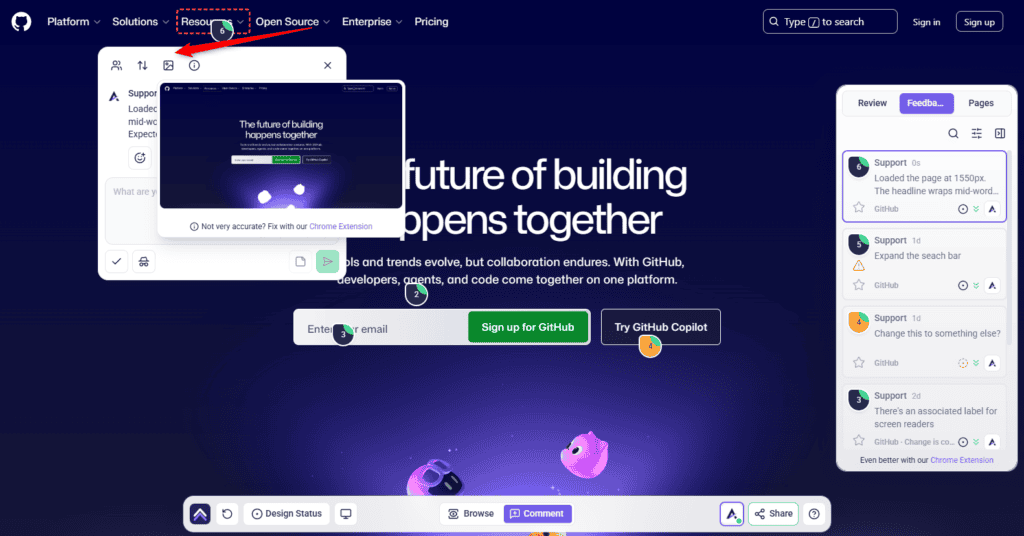
The click is what carries the context — element, screen size and browser are captured with it, so the developer does not have to ask.
Instructions:
You do not have to write down the URL, the browser, the viewport, or where on the page it happened. That is recorded for you.
What Gets Captured for You
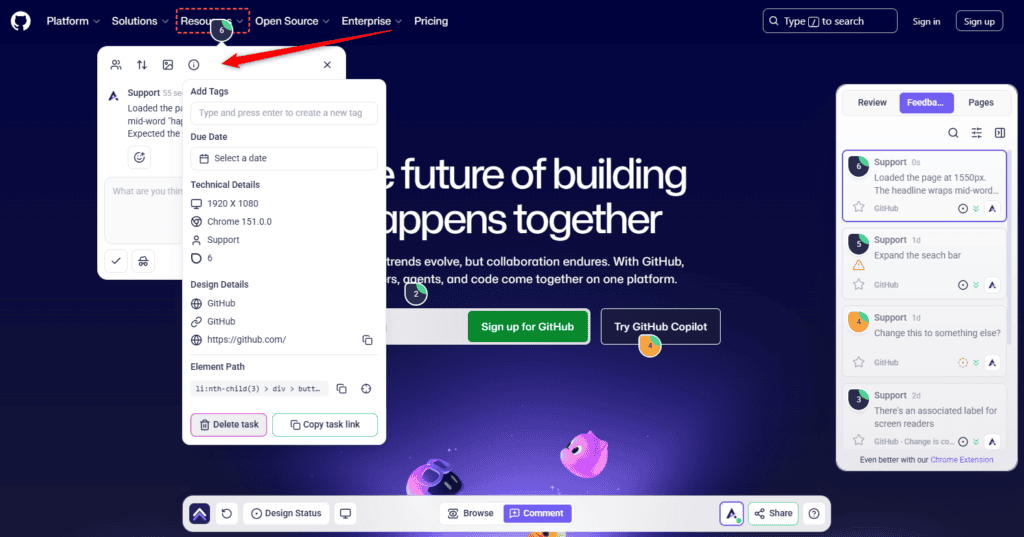
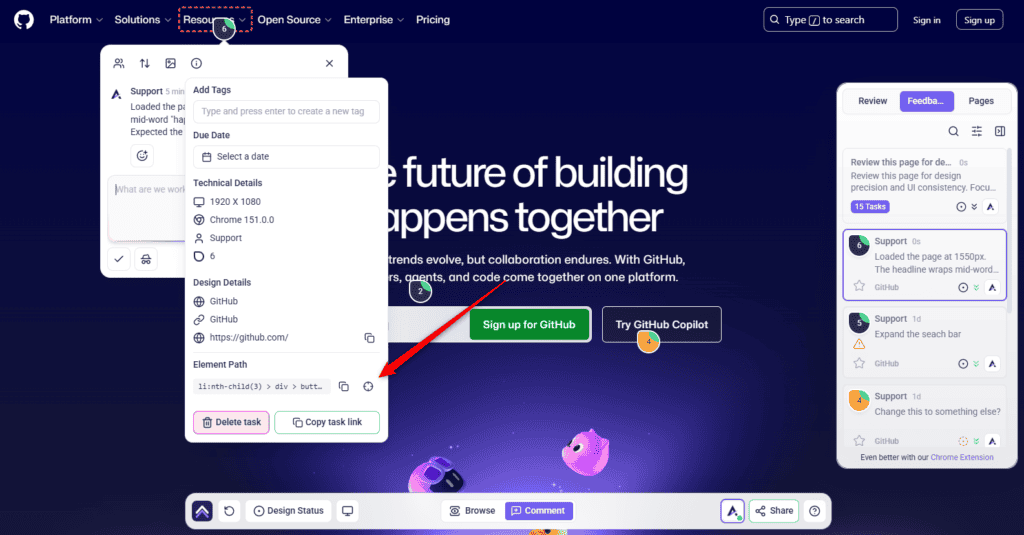
Expand Technical Details on any task to see the repro context.
| Field | Why it matters in a defect report |
|---|---|
| Element Path | The selector for the element involved, copyable in one action. |
| Page URL | Exactly where it happened, also copyable. |
| Browser | The environment — usually the answer when a developer cannot reproduce it. |
| Screen Size | The viewport, which is the breakpoint the defect actually occurs at. |
| Website Name and Page Name | Which project and page the defect belongs to. |
| Created By | Who found it, for follow-up questions. |
| Task ID and Share Link | A stable reference and a link for a test report or a standup. |
| Due Date and Add Tags | Scheduling and categorisation, editable in place. |
Annotating the Evidence
When the defect is visual, mark it up. The comment box has an annotation control, described as annotating a screenshot and attaching it as a comment, which opens a window headed Annotate screenshot.
| Tool | Use it to |
|---|---|
| Arrow | Point at the exact element that is wrong. |
| Rectangle | Box the region where the layout breaks. |
| Circle | Ring something without covering it. |
| Pen | Draw freehand. |
| Text | Label the expected versus actual directly on the image. |
| Move/Select | Reposition or resize what you have drawn. |
| Pan | Move around a tall screenshot. Hold the space bar as a shortcut. |
Undo, Redo, and Fit to Screen are available while you work. Save attaches the annotated image to your comment; Cancel discards it.
Testing Across Breakpoints
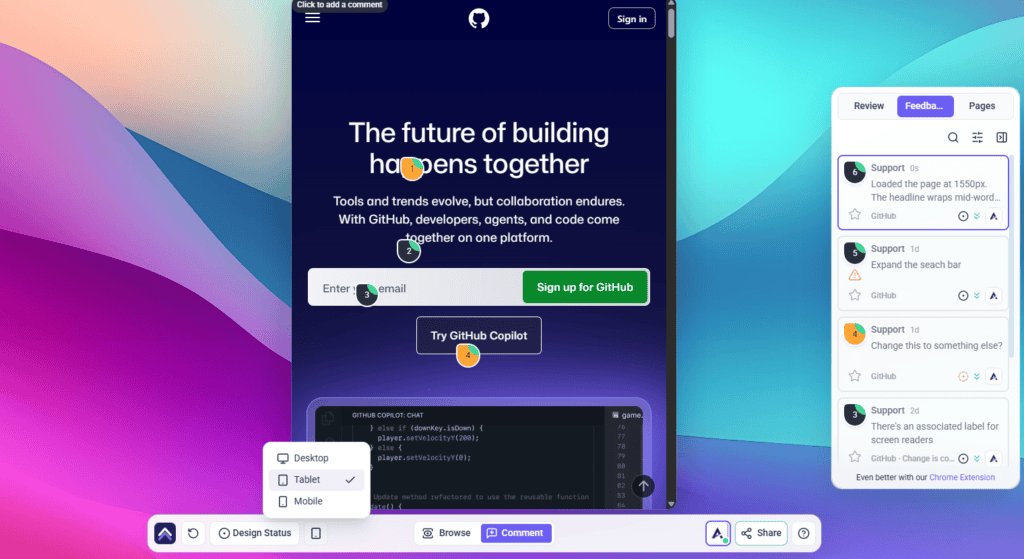
The bottom bar carries a device menu for previewing at Desktop, Tablet, and Mobile. A defect filed while a view is active is recorded against that view, so a mobile-only bug arrives already saying so.
Automated Checks the AI Can Run
Atarim’s AI team includes Glitch, which reviews functionality — interactions that break and what is breaking them. Alongside the review, the agents can run real diagnostics when you ask for them in an AI chat. These are run on request, not automatically.
| Check | What it returns |
|---|---|
| Lighthouse audit | Performance, accessibility, best practices, SEO, and PWA scores out of 100, with actionable fixes. |
| Accessibility scan | A WCAG 2.1 pass returning violations with severity and the affected nodes. |
| Colour contrast check | A WCAG 2.0/2.1 contrast ratio with AA and AAA pass or fail for normal text, large text, and UI components. |
| Browser verification | A headless browser driven through a scripted sequence of interactions against a URL, returning the document status and the result of each step. |
Findings from a page review come back in the Review tab in the sidebar, grouped by the viewport they were found in. Selecting one takes you to it on the page.
Glitch has its own guide worth reading if functionality is your focus. Read Catch Bugs Before Users Do With Glitch
Verifying Fixes
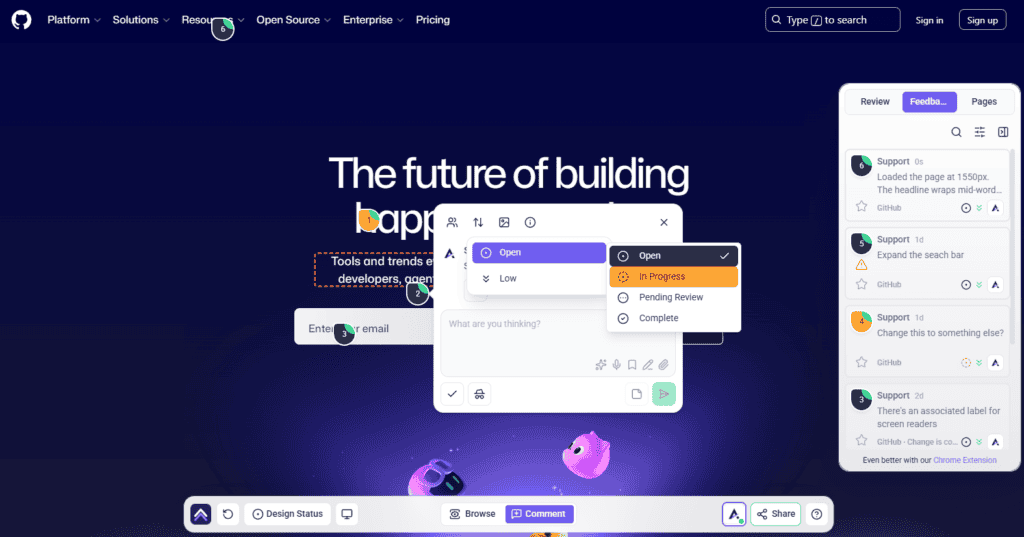
Statuses are what turn a defect list into a verification queue.
| Status | What it means to you |
|---|---|
| Open | Filed, not picked up. |
| In Progress | A developer is working on it. |
| Pending Review | Fixed and waiting on you. This is your queue. |
| Complete | Verified and closed. |
Priorities run Low, Medium, High, and Critical, set on the same control as status.
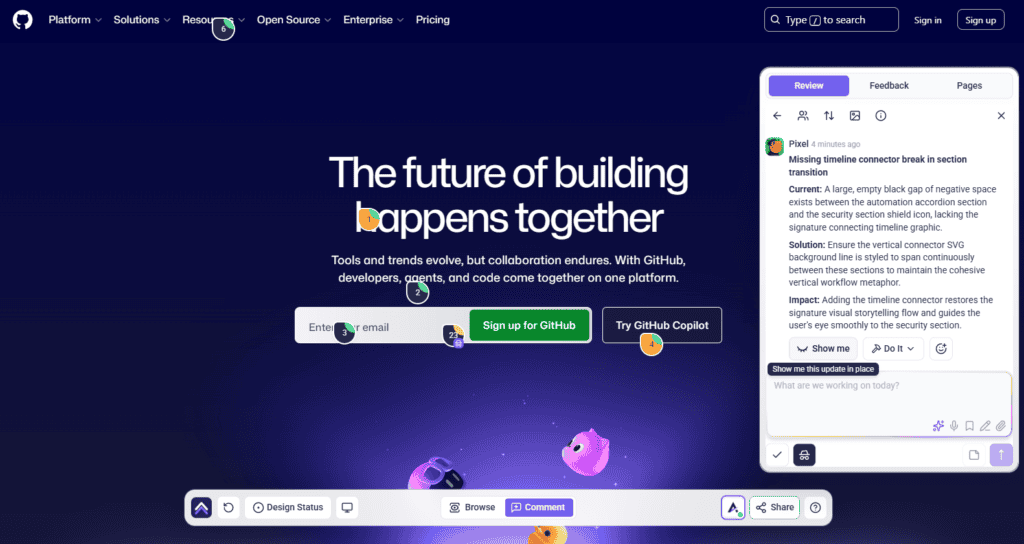
On comments Atarim has identified as actionable, a Show me control appears, with the tooltip describing it as showing the update in place. It previews the suggested change on the page without applying it, and carries controls to hide the preview again or regenerate it. That preview is a quick sanity check — not a substitute for retesting once a change is genuinely applied.
Tracking completion honestly is what makes the numbers meaningful later. See Tracking Task Progress And Completion
When the Element Has Moved
A defect pinned to an element that no longer exists reports Element not found on this page, and offers Remap to element so you can point it at the current markup.
This happens constantly in an active codebase. A refactor orphans every task attached to the renamed component, and remapping is what stops your defect list quietly rotting.
Organising a Test Run
The filters in the Tasks tab are what make a defect list workable.
Instructions:
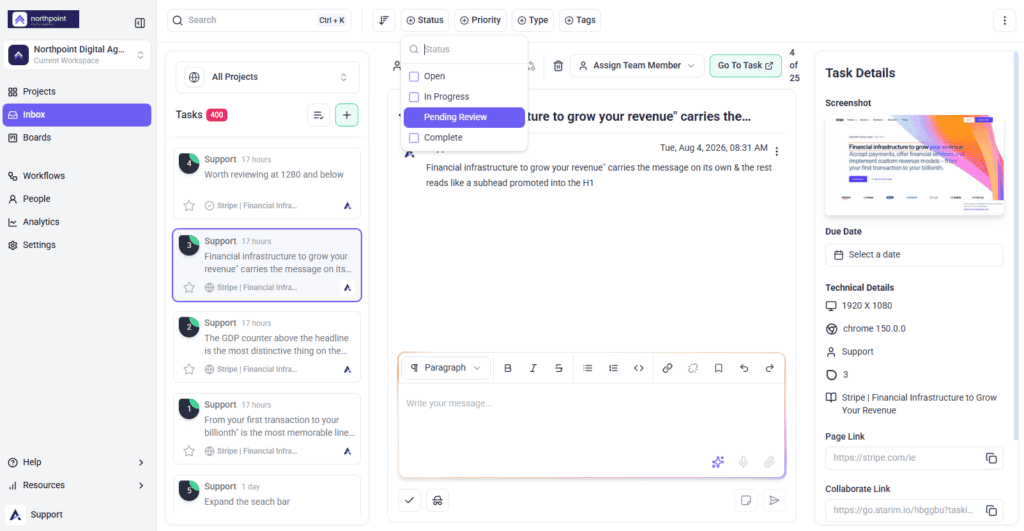
Tags are useful for cutting across projects — a regression suite, a release, a browser-specific set. They are added under Add Tags, where the field prompts you to type and press enter to create a new tag.
Keeping Test Discussion Internal
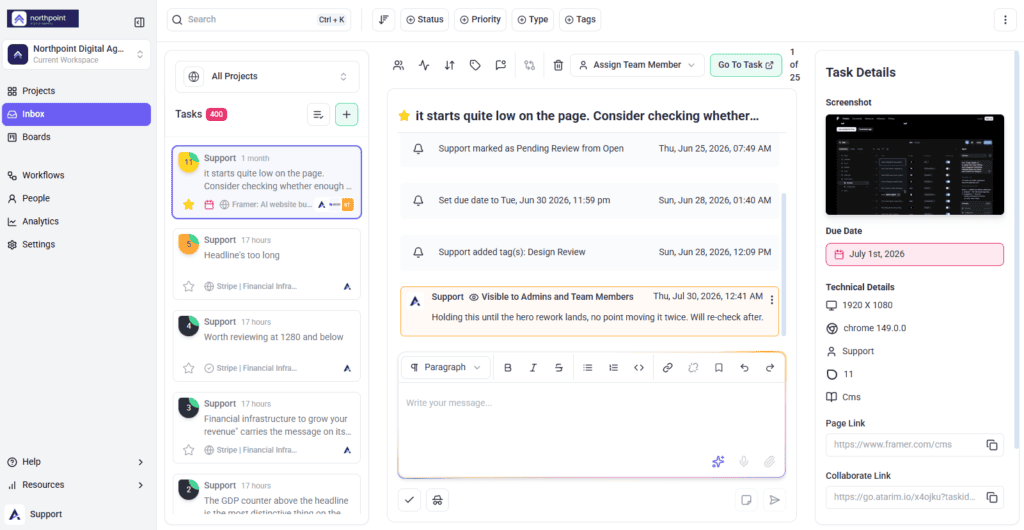
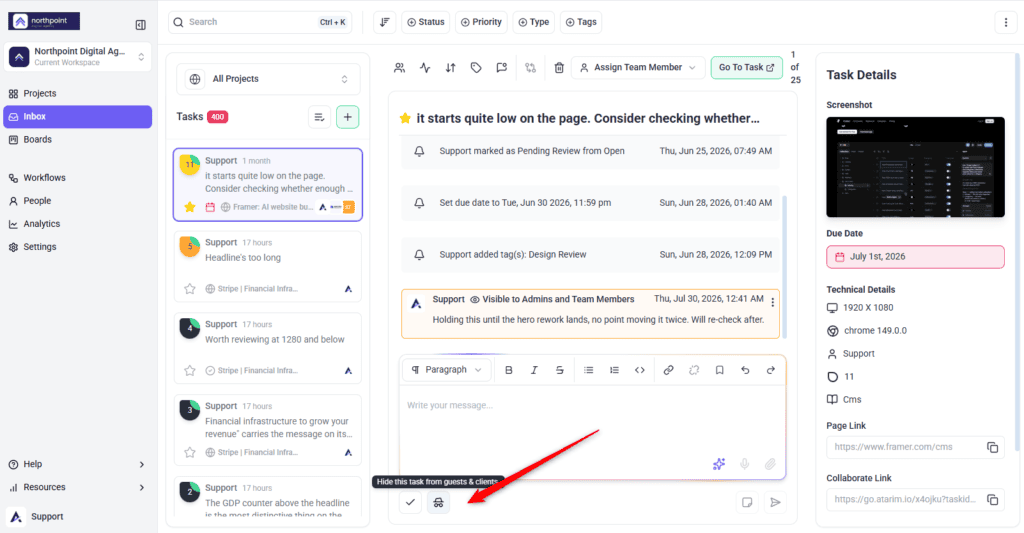
Tasks and comments can be marked internal, which hides them from guests and clients. Defect triage, severity arguments, and known-issue discussion belong there rather than in a thread a client is reading.
Benefits for a QA Engineer
| Benefit | In practice |
|---|---|
| No writing down the environment | Browser, viewport, URL, and element path are captured with the defect. |
| Fewer “cannot reproduce” rejections | The conditions are in the report rather than in your memory. |
| Evidence, not description | An annotated screenshot settles arguments a paragraph will not. |
| A real verification queue | Pending Review is a status that means the work is yours. |
| Defects survive refactors | Remapping keeps reports attached when markup moves. |
| A cheap automated first pass | Lighthouse, WCAG, and contrast checks before manual testing starts. |
Example Use Cases
| Situation | What to do |
|---|---|
| A layout bug only on mobile | Switch to the mobile view first, then file. The viewport is recorded. |
| A developer cannot reproduce it | Point them at Browser and Screen Size in Technical Details. |
| Accessibility pass before release | Ask for a WCAG scan on a public URL, then test the judgement-based criteria manually. |
| Verifying a batch of fixes | Sort by Status and work the Pending Review items. |
| After a big refactor | Look for orphaned tasks and remap them before regression testing. |
| Reporting what shipped in a release | Filter by release tag with Show Complete Tasks turned on. |
Known Limitations
FAQs
Do I need to record the browser and screen size myself?
No. Both are captured automatically and shown in Technical Details.
How do I file a bug that only happens on mobile?
Switch the device preview to Mobile first. The viewport is recorded with the task.
Can I annotate the screenshot?
Yes, using the annotation control on the comment box, with arrow, rectangle, circle, pen, and text tools.
What happens to defects when the markup changes?
They report that the element was not found and offer Remap to element.
Which status means a fix is ready to verify?
Pending Review. Treat that as your verification queue.
Can Atarim run accessibility tests?
Yes — a WCAG 2.1 scan, plus Lighthouse and contrast checks, on request in an AI chat and against publicly reachable URLs.
Can I test a staging site behind a login?
You can file defects on it as normal, but the AI diagnostics exclude authenticated and internal URLs.
Can I hide defect triage from the client?
Yes, using internal tasks and notes, where enabled on your plan.
Can defects be pushed to Jira or ClickUp?
Yes. Atarim integrates with the major trackers, plus Slack, webhooks, and Zapier.
Can I rename the statuses to match our defect workflow?
No. The four statuses and four priorities are fixed.
Common issues
- “Element not found on this page” — the markup changed. Use Remap to element to reattach the defect.
- Clicking a link leaves a comment instead of navigating — you are in Comment mode. Switch to Browse, navigate, then switch back.
- An accessibility or Lighthouse check returns nothing useful — the URL is not publicly reachable. Run it against a public environment.
- Defects are being closed without verification — agree that fixes go to Pending Review and QA closes them.
- Filters are missing from the sidebar — open the Tasks tab; the controls appear with it. If still absent, filtering is not enabled for your role.
- No Show me control on a comment — it appears only on comments marked actionable, and not while a change is queued.
- The screenshot does not match the page — it is a snapshot from when the defect was filed. The page has changed since.
- Internal tasks are locked — not included on your plan. Do not assume a comment is hidden.
- You cannot find a defect you filed — the list may be scoped to the current page. Widen the scope, or turn on Show Complete Tasks.
- Technical Details is missing fields — your role does not carry full visibility. Ask an administrator.
Conclusion
File from the breakpoint the defect occurs at, spend your words on the steps rather than the environment, annotate when it is visual, and hold the line that QA closes defects rather than developers. The context comes free — the discipline around verification is what actually stops regressions shipping.
It helps to understand how the developers receiving your reports work. Explore Atarim For Frontend Developers
Tips & best practices
- File from the breakpoint the defect occurs at — the viewport is recorded.
- Write the steps, not the environment. The environment is captured.
- Label expected versus actual on the annotated screenshot.
- Copy the Share Link into test notes rather than the task title.
- Treat Pending Review as your verification queue.
- Never let a fix go straight to Complete without verification.
- Check for orphaned tasks after a refactor and remap them.
- Run automated checks first, then spend manual time on what a scan cannot judge.